Skills / Prove the Value / Cost of data error
DODBELLAI

Cost of Bad Data

Computes what data and AI errors actually cost, from your own tickets, logs and lineage, and never from industry averages.

Private skill · shared by invitation · How access works
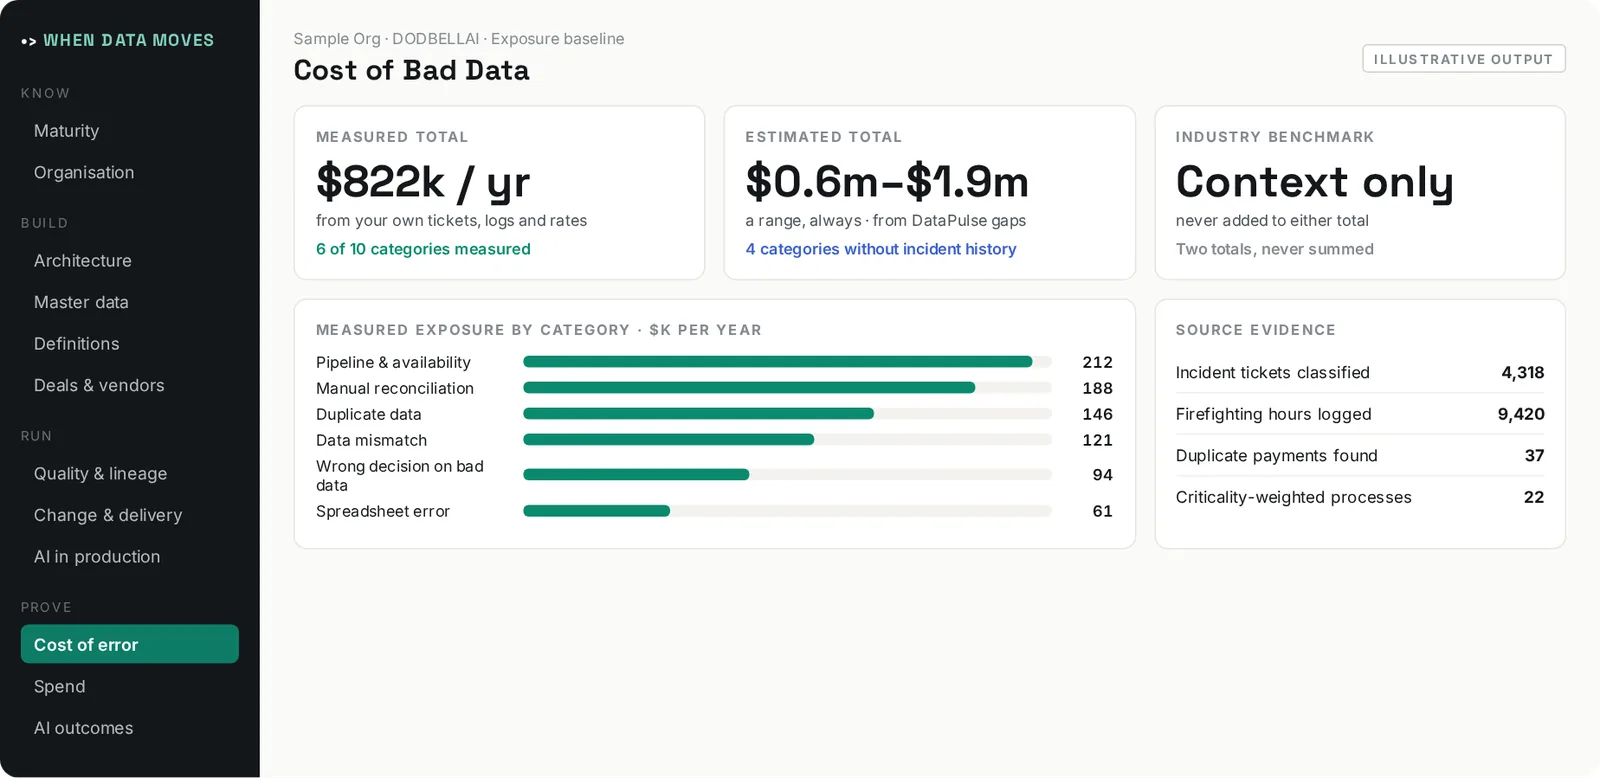
Illustrative output of Cost of Bad Data: Computes what data and AI errors actually cost, from your own tickets, logs and lineage, and never from industry averages.
Illustrative output with sample data.
The challenge

Your CFO asked what bad data is costing. You said “a lot”.

Borrowed numbers

Board slides quote industry reports that Finance won't accept.

Blended totals

Measured and estimated costs get summed into one number.

Thousands of tickets

Issue logs exist, but nobody has added them up.

Unsound claims

Vendor ROI slides go unchallenged.

How it works

From first question to finished output.

Build the baseline

Classify incidents from tickets, logs and loss records into ten categories.

Weight by criticality

A business-criticality weight per process.

Keep classes apart

Three evidence classes, three totals, never summed.

Bridge from maturity

Link DataPulse gaps to where to instrument first.

What you get

  • An exposure figure computed from your tickets, logs and lineage
  • Measured and estimated exposure held apart
  • A defensible basis for a remediation business case

What goes in

Incident tickets, operational logs, lineage, loss records where they exist.

Time to answer

As a consulting engagement8 weeks2 people · 16 consultant-weeks
Running the skill2–3 hoursone sitting, start to finished output

What it still needs from you

Agreeing with Finance what counts as a loss.

Also in Prove the Value

See where this fits in the sequence →

See Cost of Bad Data in action.

Thirty minutes with Harveer, on your own data problem.